The Channel Scoring module allows you to check, among other things:
- What is the number of users involved in a particular communication channel (email or SMS);
- How the audience base changes over a certain period of time;
- How a particular user behaves;
- What does seasonal user engagement look like at the base.
Scoring is intended to help us choose the right type of communication over time. If we use additional segmentation (get to know our audience’s preferences better – what they click on, what they buy and when), we can better plan all communication.
Where to start with Channel Scoring configuration?
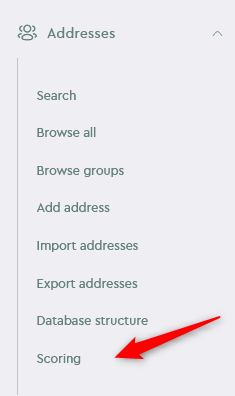
To start calculating a new scoring we go to the tab Addresses -> Scoring
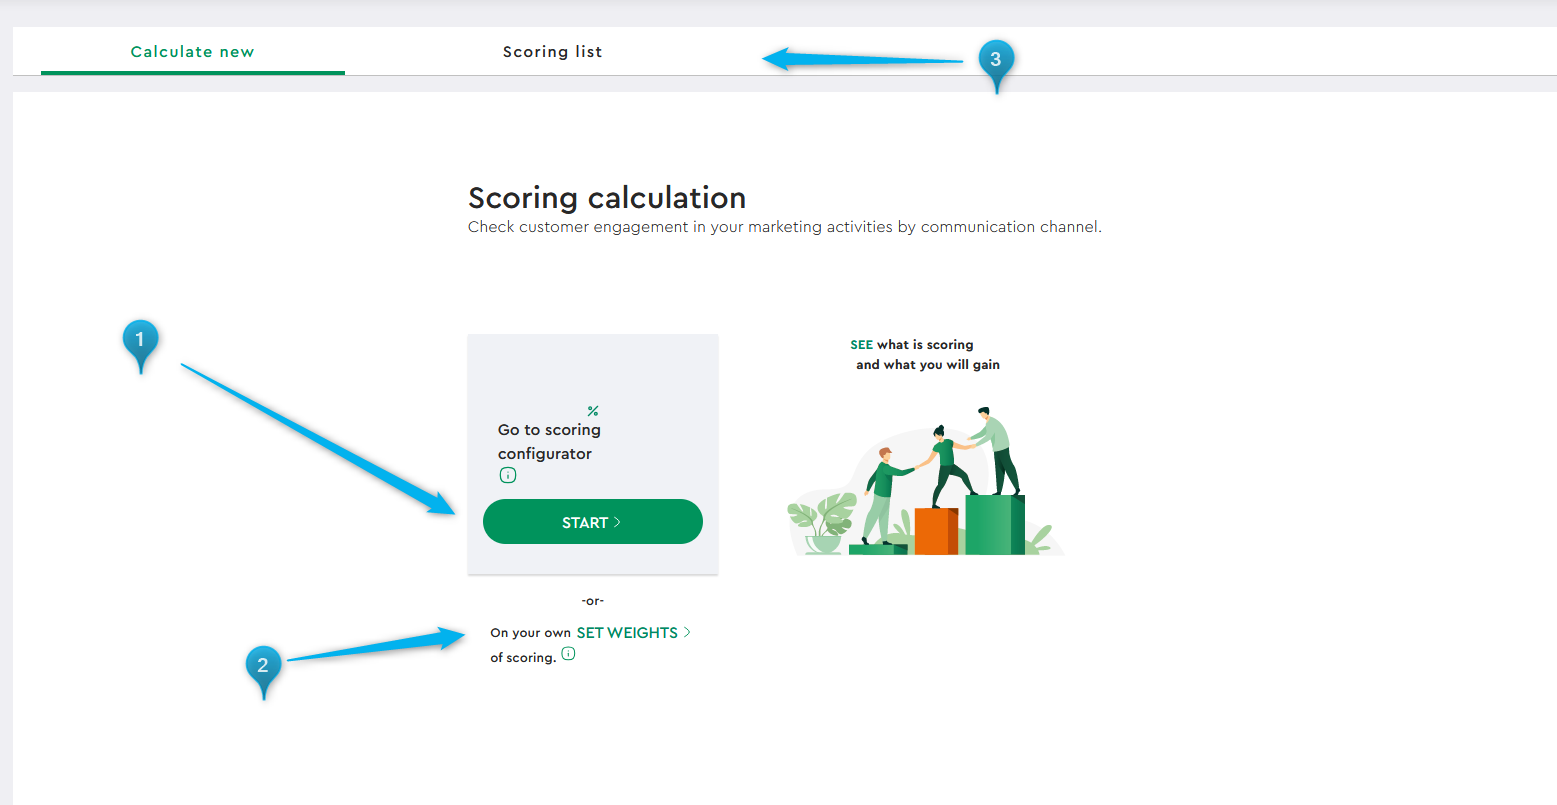
Here we can start calculating a new scoring using the simple configurator (1), the advanced configurator (2), or read the brief instructions.
There is also a tab with a list of already configured scorings.
Scoring calculation – simple configurator
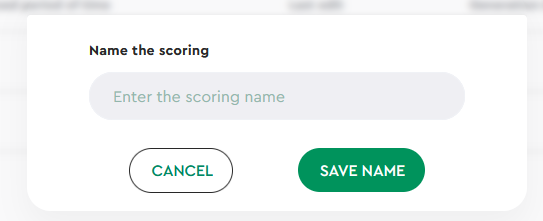
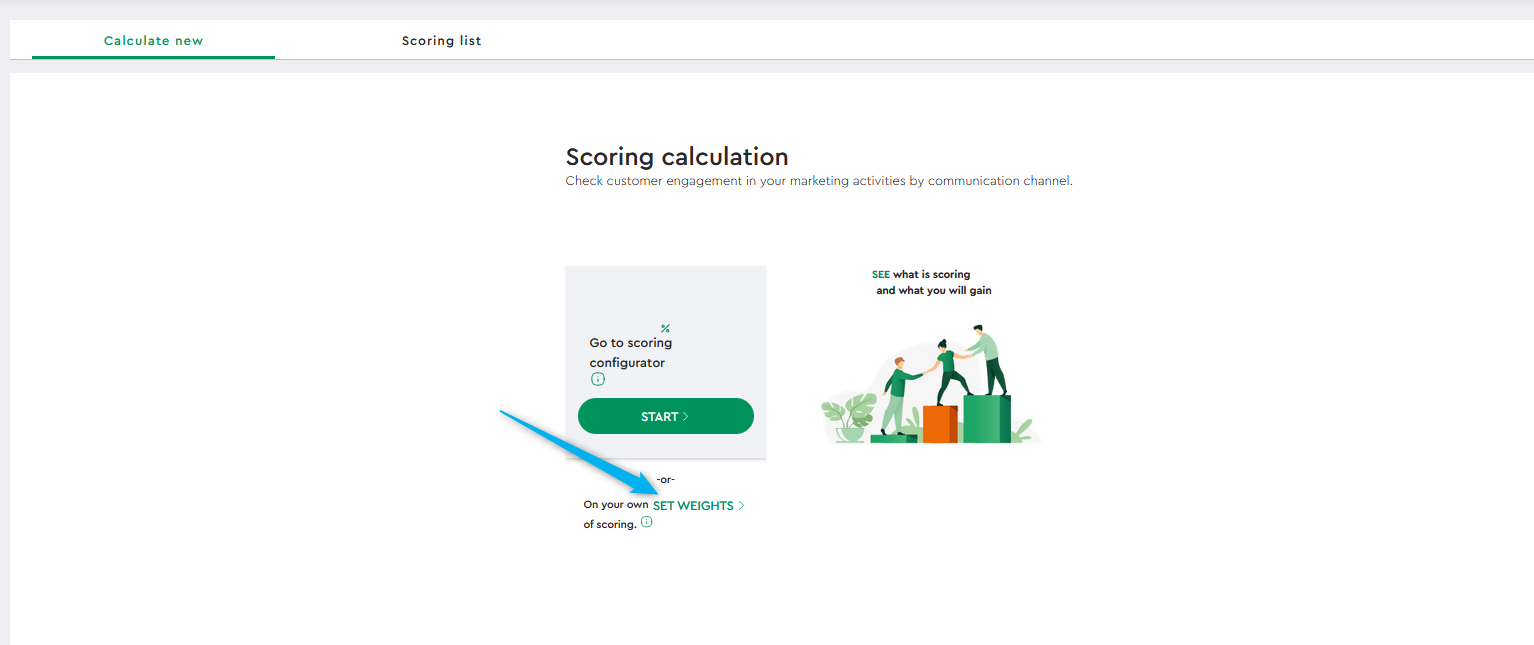
To go through the simpler configurator, select the Start button. In this option, there is no need to set the weight values of the various shipping parameters yourself. The system will do it for us automatically. After clicking Get Started, a window to set the scoring name appears:
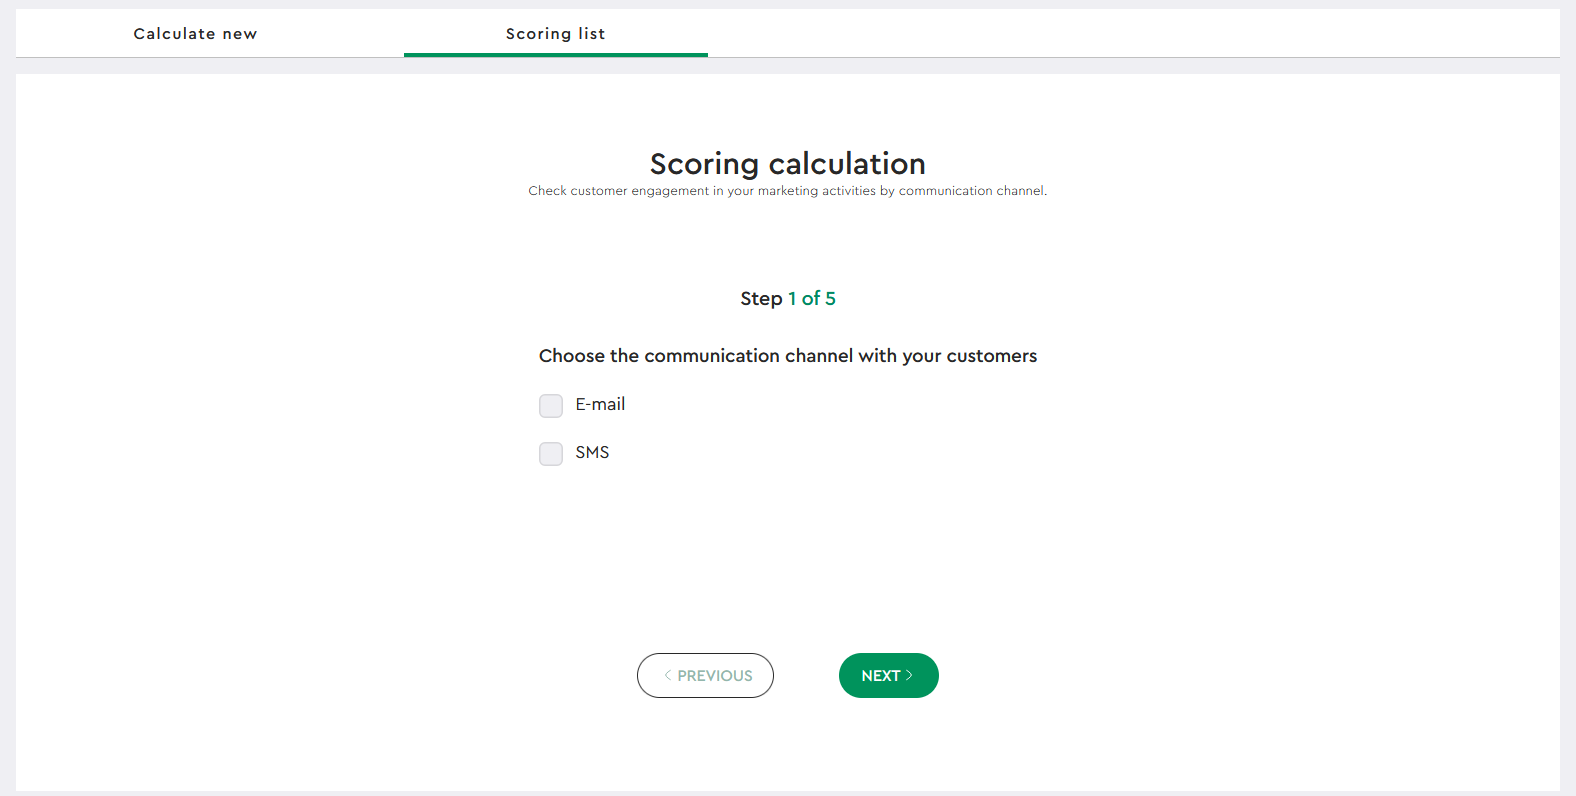
Step 1
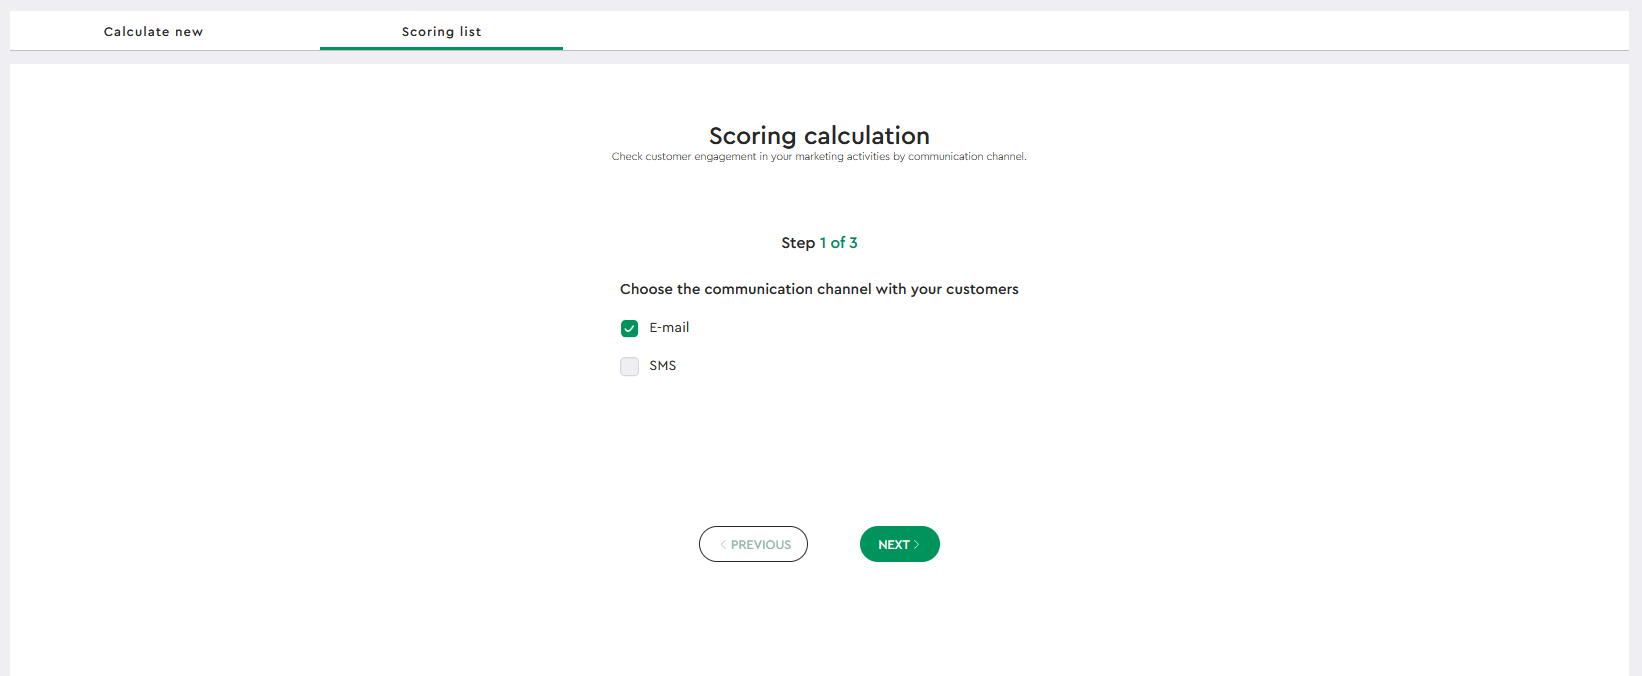
We start the configuration by selecting the communication channel we want to analyze. We have a choice of e-mail or SMS communication. If we want to examine only emails, we select them and move on:
Step 2
Now we need to specify what type of campaigns are sent to our recipients. We have 5 different types to choose from, each of which is described in detail. Choosing the right type of communication is very important, because each of them systemically has different weights assigned to opens, clicks and deliverability, which affects the calculation of scoring.
For example, in sales and advertising campaigns, click-through rate will be given more weight, and in information campaigns, message deliverability will be given more weight.
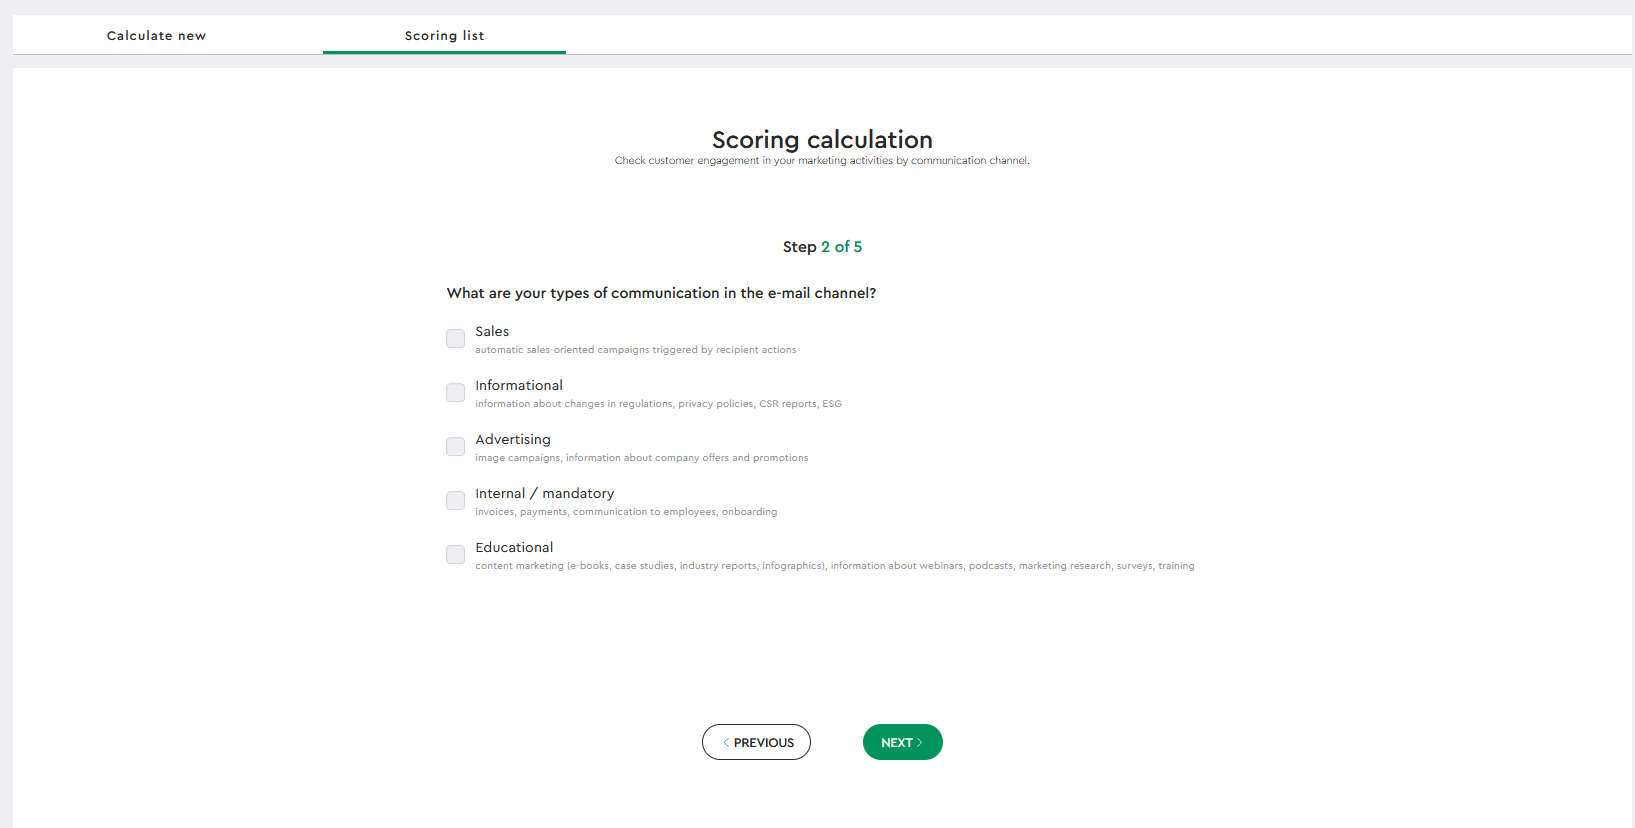
Let’s assume that our messages are informational and advertising dispatches. We mark them and proceed to step No. 3.
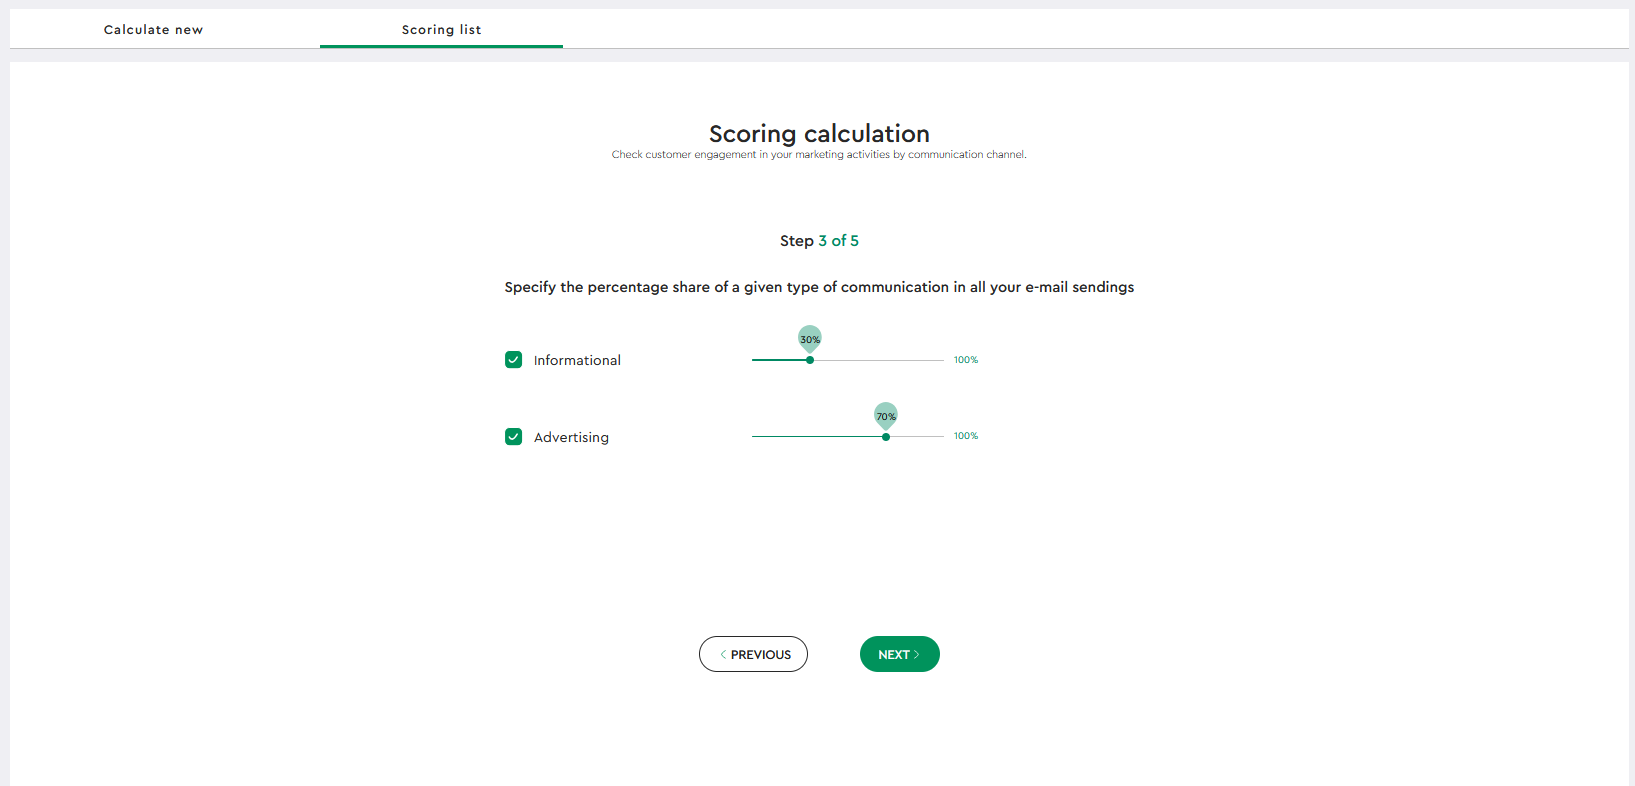
Step 3
At this stage, we need to set with the sliders the percentage of the types of communication selected in the previous step in all shipments. Note that the sum of the two ranges must total 100%. The system will help us set these figures.
For example: informational messages account for 30% and advertising for 70%.
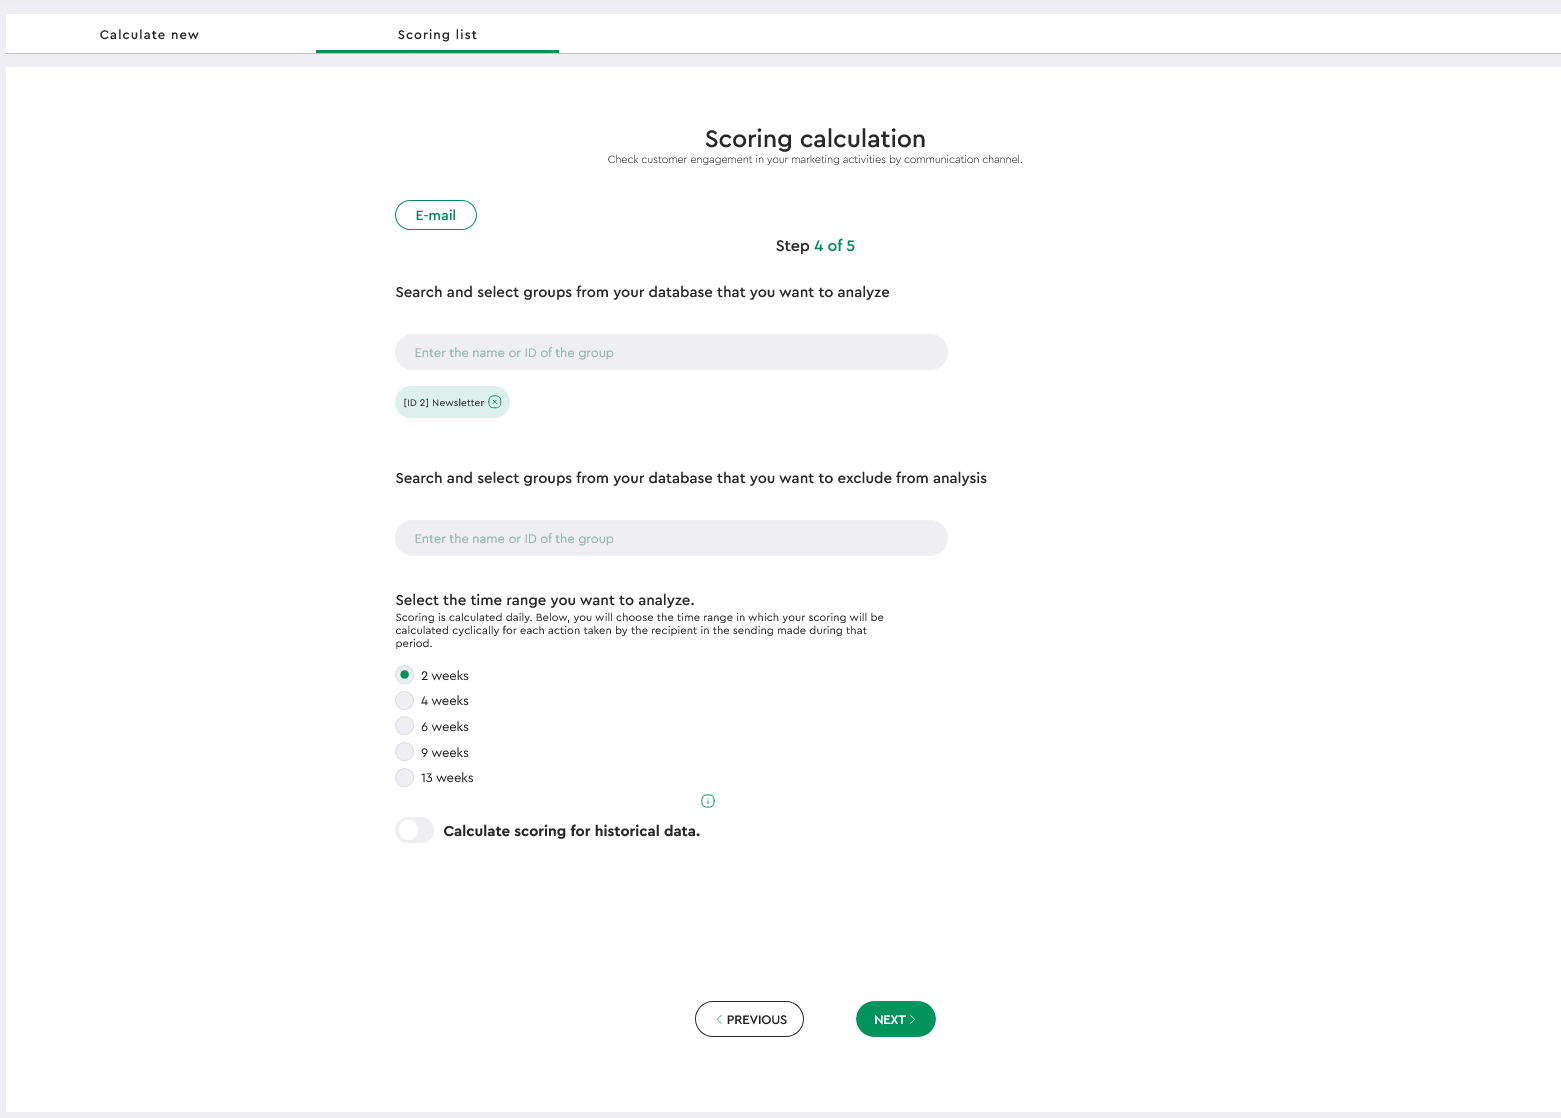
Step 4
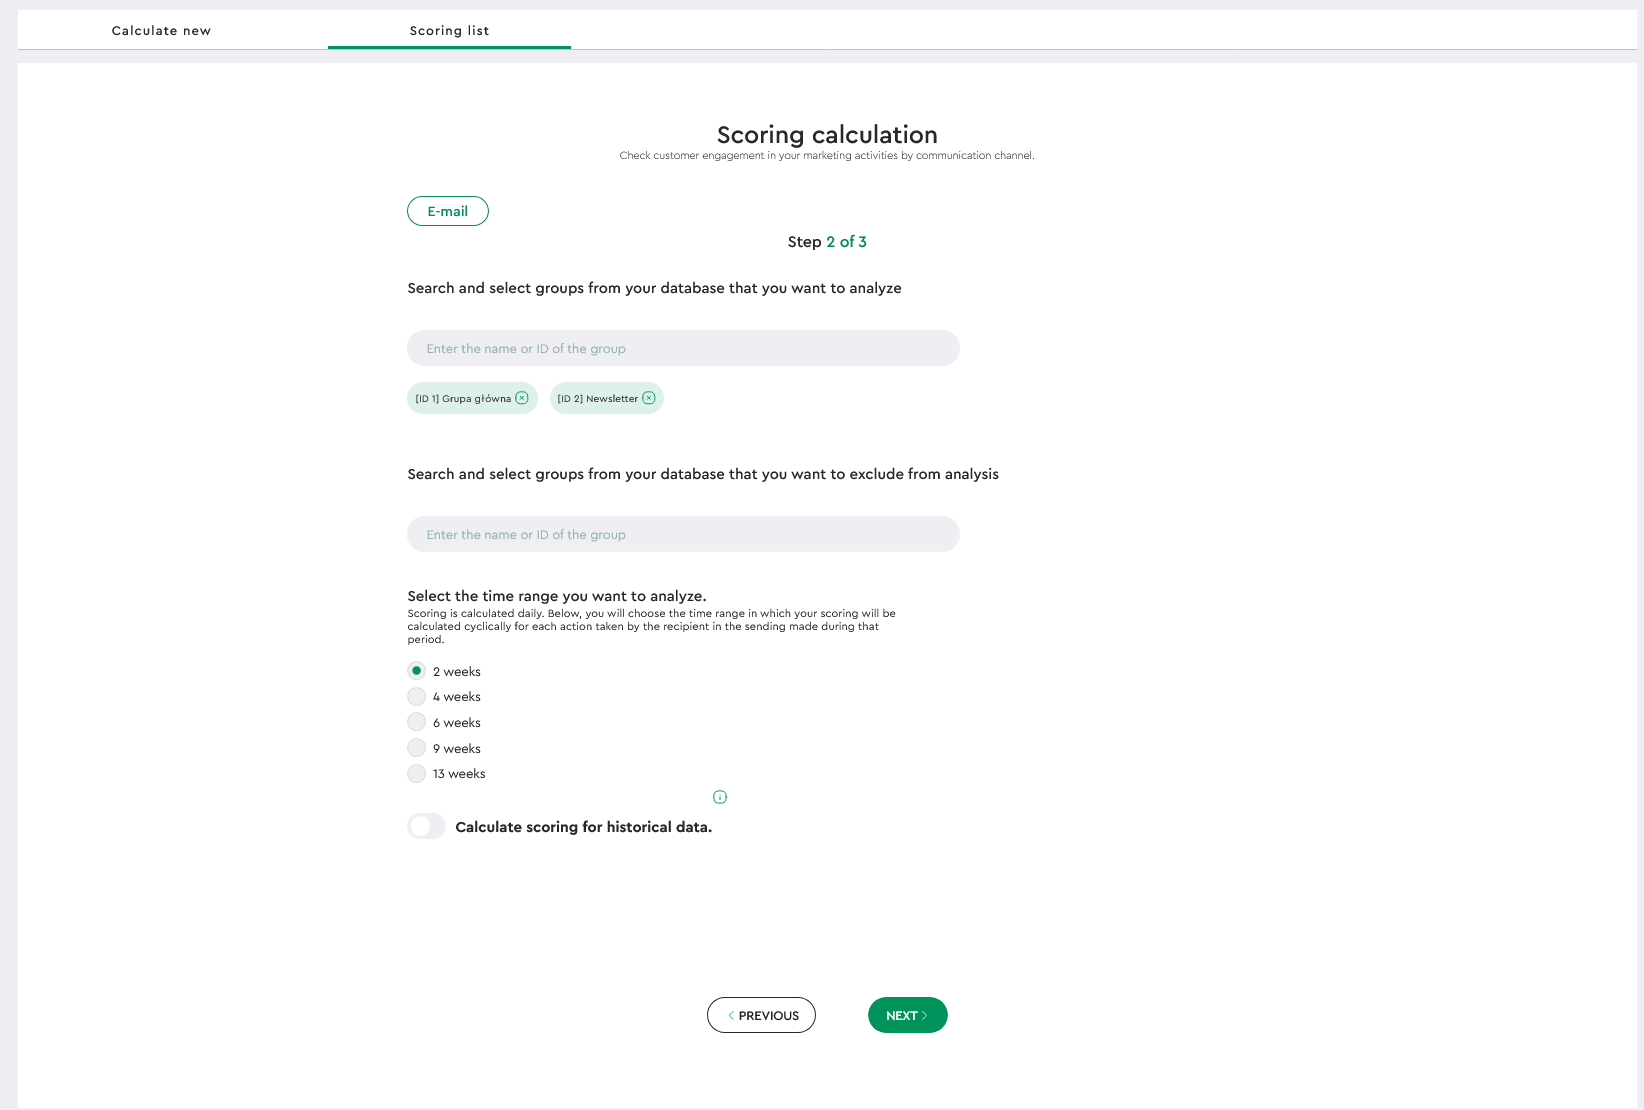
In this step, we choose which addresses from the database we want to take part in the scoring, which ones we want to exclude and what time range we want to analyze. In selecting the groups, it is important that they are appropriately matched to the types of mailings we selected in the 2. step .
For example, we want to analyze addresses that simultaneously meet all three conditions:
- They participated in the shipments.
- They are located in ID Group 1.
- They are not in ID Group 2.
The selection of the time range for the analysis is also very important and should be set
According to the frequency of shipments made.
- If we are running multiple campaigns, the appropriate interval would be four weeks, so that the data is accurate.
- However, if you send campaigns from time to time, then it’s a good idea to choose a longer range so that the data is meaningful and not dependent on just one message sent.
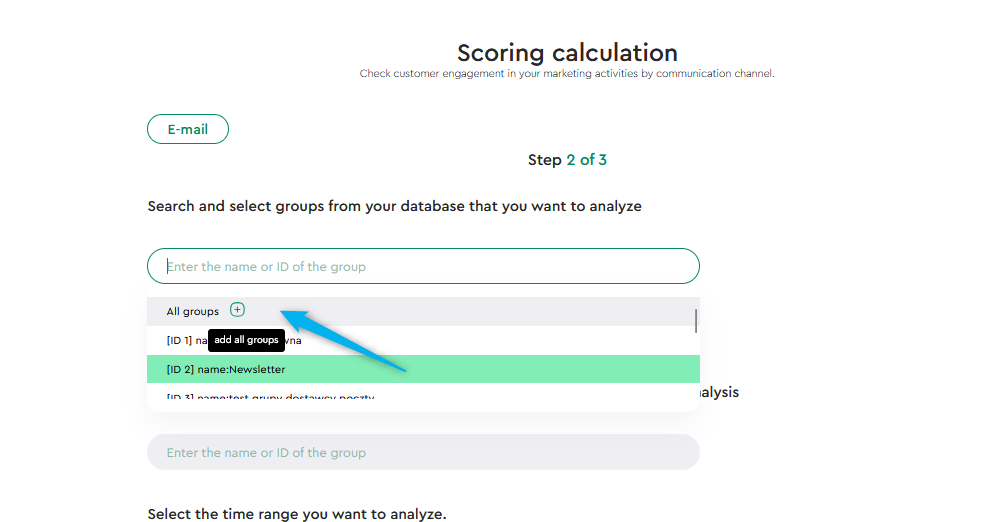
Suppose we send a very large number of messages and want to analyze a period of 4 weeks:
We have the ability to select all groups with one click and analyze our entire base:
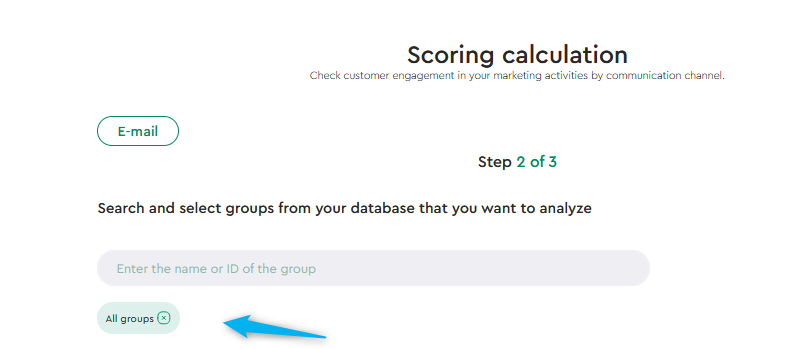
NOTE: If we select all the groups and mark one of the groups to be omitted below, the indicated group will not be taken into account. If we want to remove any of the already selected groups, we can easily do so by clicking on the X button:
Step 5
In the last step we get a summary of what we managed to set up in the previous steps:
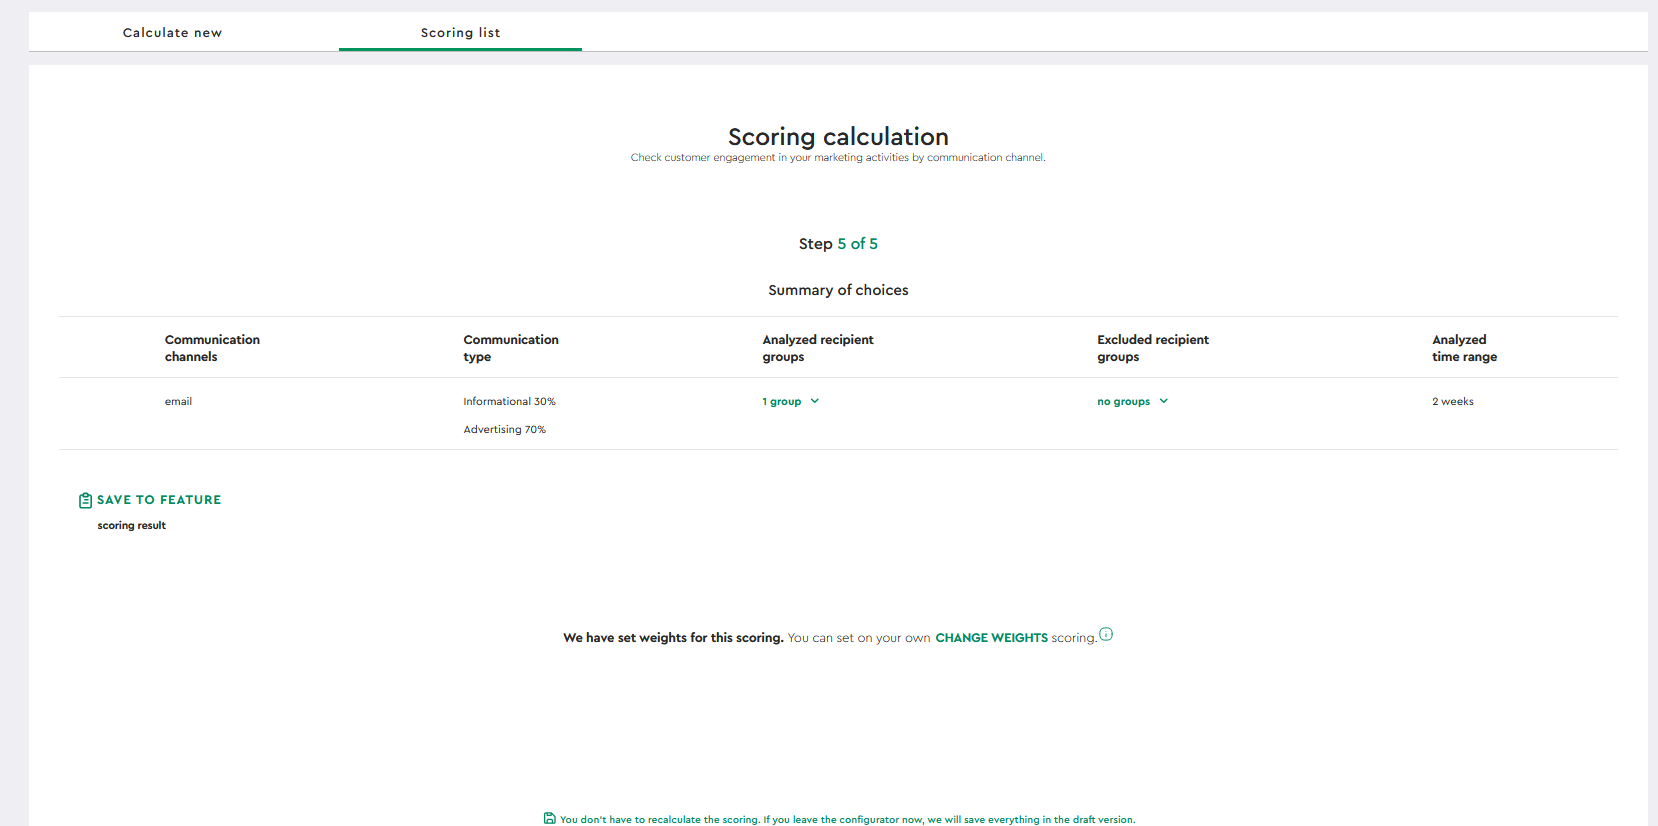
In this step we can also determine to which characteristic of the e-mail address the scoring should be assigned. This way we will always be able to view the current scoring value next to the address.
In the case of active scoring in the account, the value in the trait is updated daily if there is a change in its value after calculation. In other situations, the value from the last score remains.
After clicking on the Save to trait option, a drop-down menu will appear:
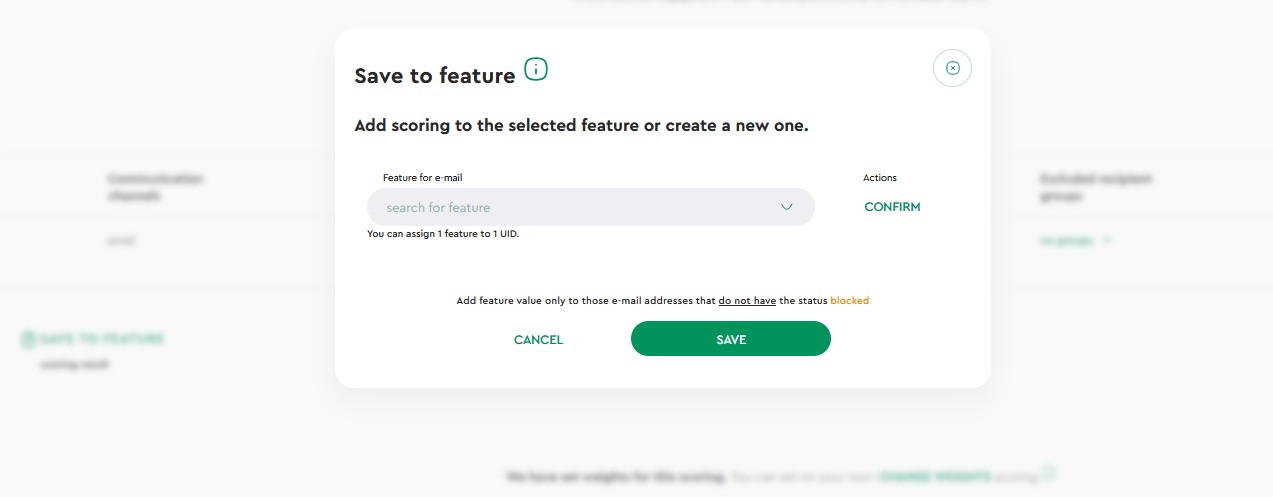
We can select a trait that already exists in the account, or we can click on Create New Trait
and add it at this stage. After selecting a feature, we click CONFIRM and then SAVE.
IMPORTANT!
If we have several scorers in the account, each of them must have a separate feature to record the results. It is worth remembering that each scoring performs operations on the base, which can affect its performance. Therefore, we recommend setting one active scoring in the account.
Finally, we click on the RECALculate SCORING button:
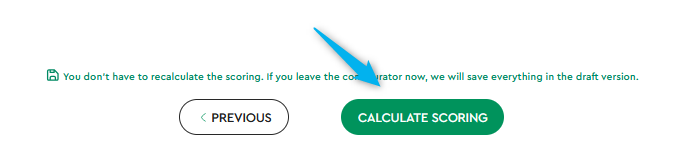
Once clicked, you will see that the scoring has started to recalculate, and the results will be available the next day in the Scoring List section, as well as in the Reports tab -> Scoring.
IMPORTANT!
It is worth remembering that the active scoring in the account recalculates daily, so the rating of individual addresses will change. The set time range under the selected scoring each day moves by one day on the calendar. Therefore, it is important to remember that when analyzing one day’s score for a given group of addresses, the system takes into account the marked range. When we check the same scoring, for example, 5 days later, we must remember that the result may already be different. The date range of scoring has also moved by 5 days and takes into account dispatches from this new range.
ADVANCED – Modification of scoring weights
Before recalculating the scoring, by clicking on CHANGE WEIGHT, we still have the option to modify the weights that were set by the system based on our indications in the earlier steps. This already involves the advanced configurator.
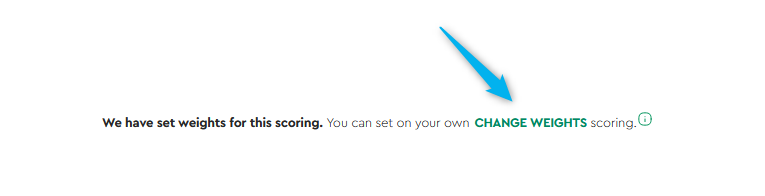
After clicking, a window will appear, in which we will see what weight the system assigns to the parameters:
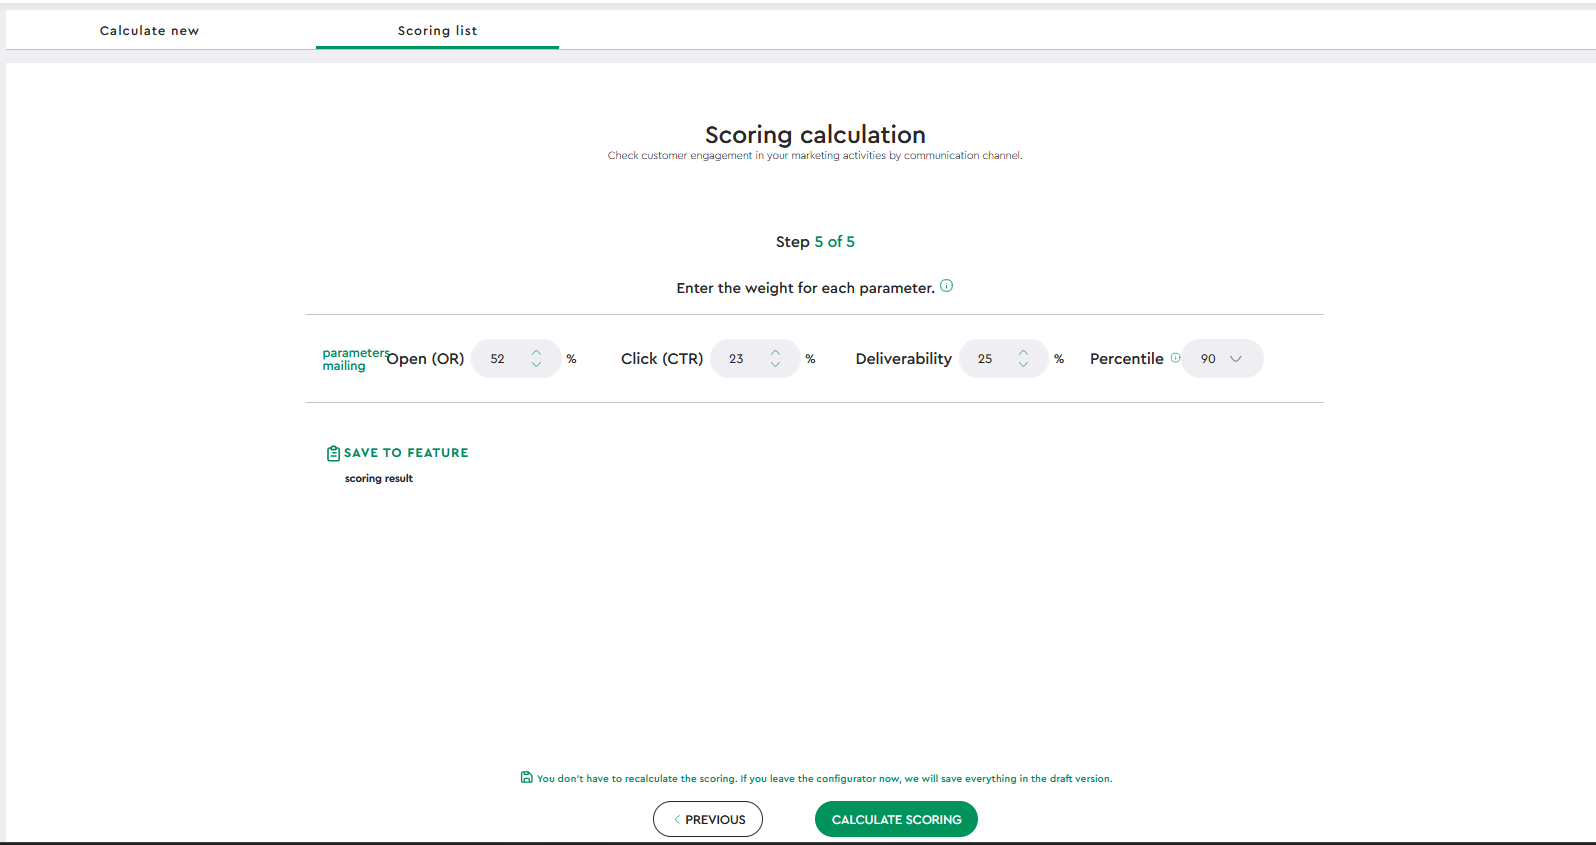
Here we can change at our discretion what value to choose for opens (OR), clicks (CTR), deliverability.
By determining the scoring based on email and sms records, we look for the ideal user for each analyzed day and over the analyzed time period.
An ideal user is one who showed the most activity (had the highest OR open rate and CTR click-through rate among those analyzed).
In this assessment we use, among other things, percentile, which allows us to determine what portion of the base scores above or below a given threshold.
For example: specifying a percentile at the 90th level means that 90% of the collection is at the 90th level and only 10% score above it.
According to the set percentile value, the entire scoring will be recalculated, so it is worth checking the average opening results from your campaigns first. If the opening % is low, it is worth setting the percentile at a high level, on the other hand, if the opening % is higher – the opposite.
This procedure will ensure that the results of the scoring will be most meaningful and avoid equating the converted addresses to a single, misleading result.
Scoring calculation – advanced configurator
We have the option to set the values of individual parameters for calculating the scoring ourselves. To do this, we start the calculation by clicking on the option SET scoring weights independently.
Step 1
We start the configuration by selecting the communication channel we want to analyze. We have a choice of e-mail or SMS communication. If we want to examine only emails, we select them and move on:
Step 2
In this step, we choose which addresses from the database we want to take part in the scoring, which ones we want to exclude and what time range we want to analyze. In selecting the groups, it is important that they are appropriately matched to the types of mailings we selected in the 2. step .
For example, we want to analyze addresses that simultaneously meet all three conditions:
- They participated in the shipments.
- They are located in ID Group 1.
- They are not in ID Group 2.
The selection of the time range for the analysis is also very important and should be set
According to the frequency of shipments made.
- If we are running multiple campaigns, the appropriate interval would be four weeks, so that the data is accurate.
- However, if you send campaigns from time to time, then it’s a good idea to choose a longer range so that the data is meaningful and not dependent on just one message sent.
Suppose we send a very large number of messages and want to analyze a period of 4 weeks:
We have the ability to select all groups with one click and analyze our entire base:
If we select all the groups, and mark one of the groups for omission below, the indicated group will not be taken into account. We can also easily deselect the entire base or individual groups by deleting by clicking on the X:
Step 3
In step three, after selecting the customer communication channel, the configurator of weights for each parameter will appear:
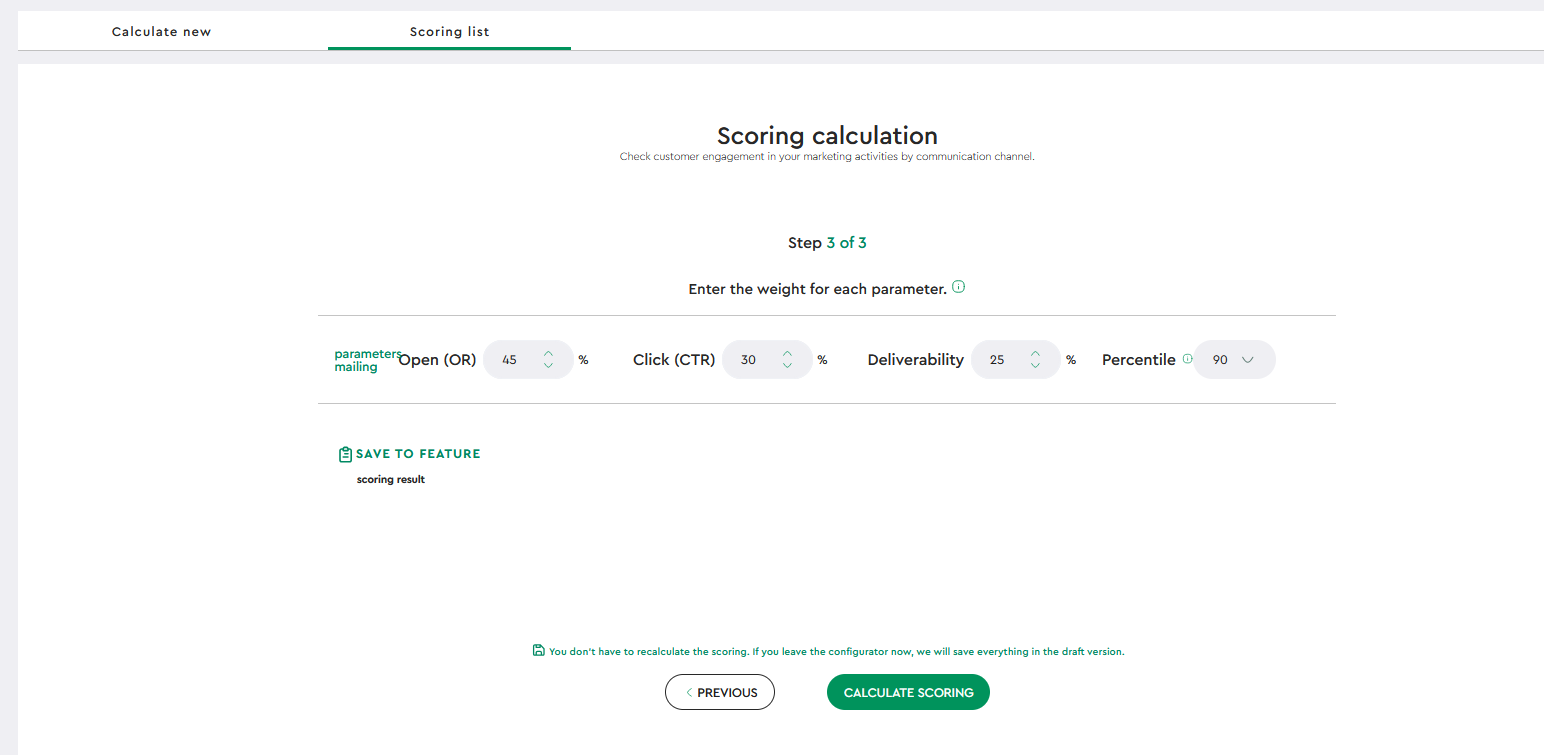
Here the system substitutes default values for the weights that we think are most favorable, but we can also set them according to our own preferences. We can at our discretion change what value to choose for opens (OR), clicks (CTR), deliverability.
The ideal user is the one who showed the highest activity (had the highest OR open rate and CTR click-through rate among those analyzed). In this evaluation, we use, among other things, percentile, which allows us to determine what portion of the base obtains results above or below a given threshold.
For example: by specifying a percentile at 90th, it means that 90% of the collection is at the 90th level and only 10% scores above it.
According to the set percentile value, the entire scoring will be recalculated, so it is worth checking the average opening results from your campaigns first. If the opening % is low, it is advisable to set the percentile at a high level, on the other hand, if the opening % is higher, vice versa.
This procedure will ensure that the results of the scoring will be most meaningful and avoid equating the converted addresses to a single, misleading result.
The system substitutes a value of 90 for us, but it is worth analyzing whether it will be optimal for our calculation. We can also set the feature to which the scoring values will be written.
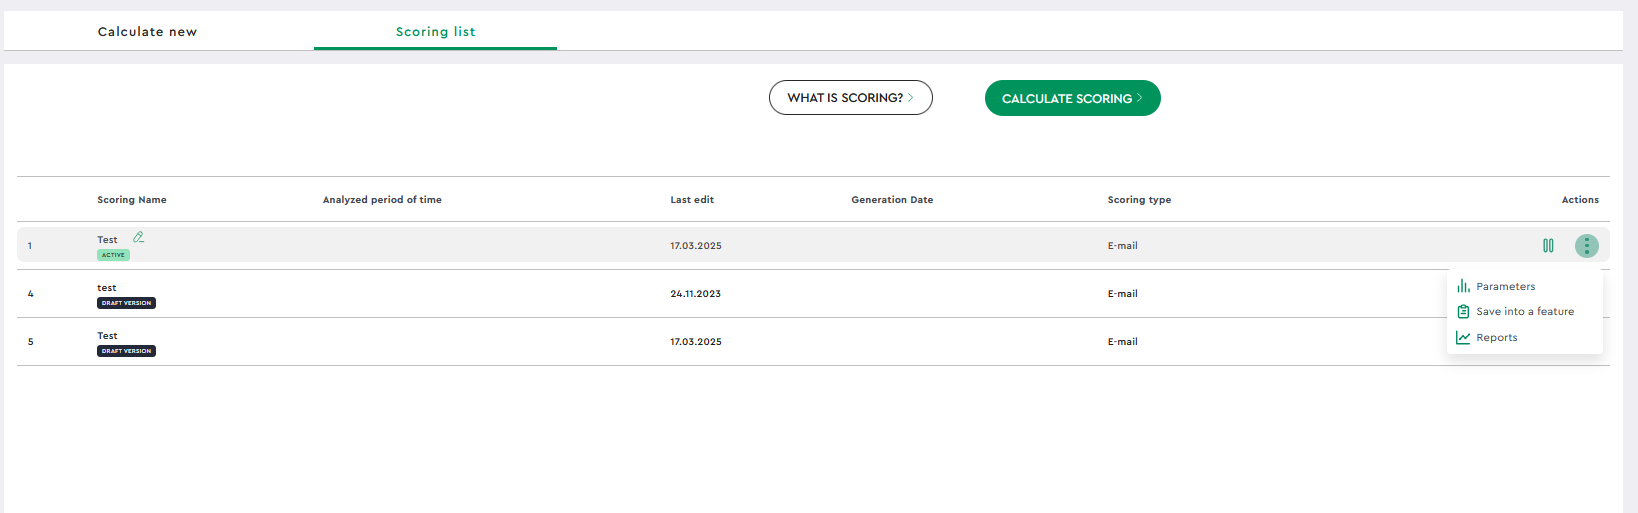
Scoring list
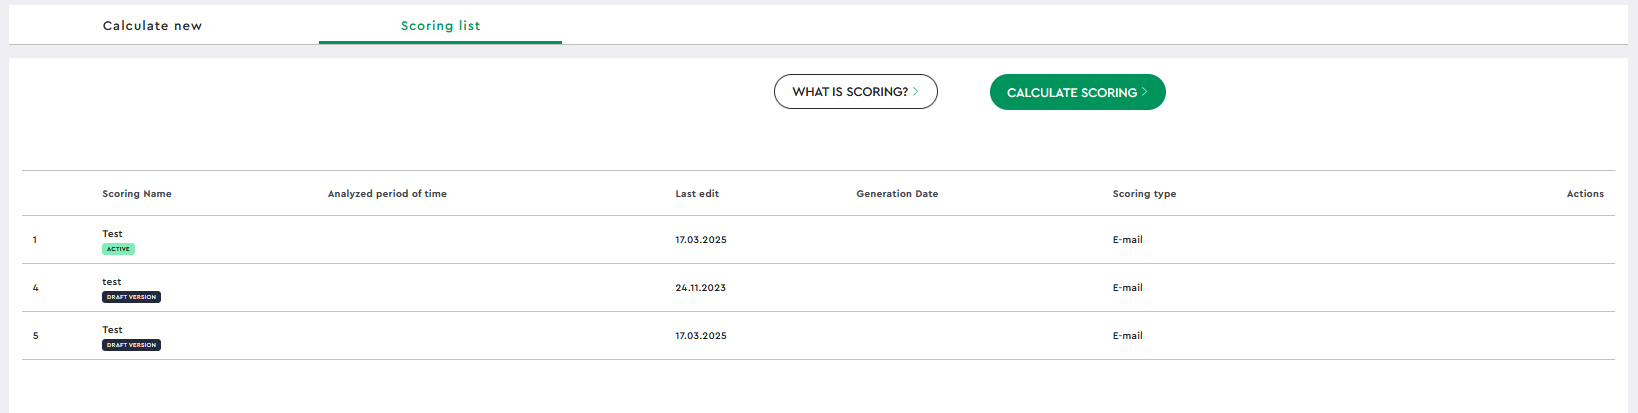
After clicking on the Scoring List tab, we have a preview of all the scorings in the account.
They can have 3 statuses:
- active – scoring currently processes the data and calculates the result every day. From here we can view the parameters, reports, and also set the record of the results to the trait if it has not been previously defined. Editing such a scoring is possible only when the scoring has not yet given any values. Therefore, it is worth paying special attention to the correctness of the data entered. When a scoring is active, we can also see the current date range being analyzed.
- inactive – scoring is not currently running in the account. We can preview reports, parameters, set the record of results to the trait, we can go to edit assumptions. We can also run it at any time.
- Draft version – is a scoring in the process of setting parameters, which has not yet been fully configured. We can go to edit to change the assumptions or complete them. We can also delete draft versions.
IMPORTANT! The system automatically saves our work in a draft version.
After hovering the cursor over the selected scoring, we have the option to stop/start it, as well as to go to the parameter preview, change the record to the feature or to the report:
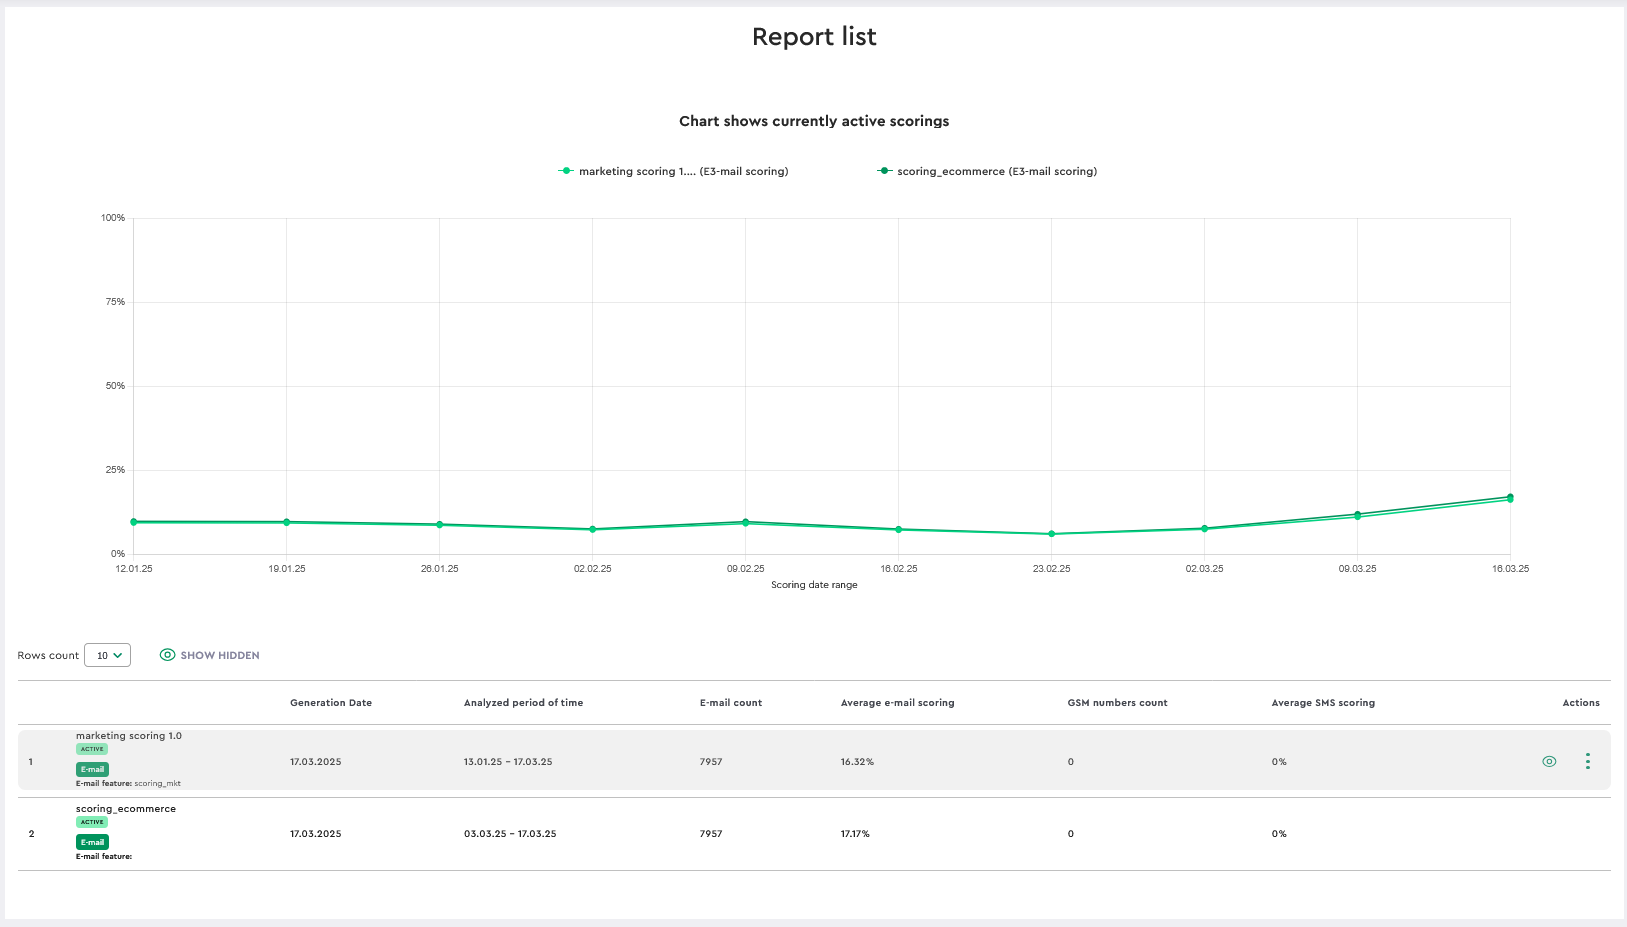
Reports
Scoring is supposed to explore and help activate the dormant base, as well as reach with communication at the right time (e.g. seasonality). A good solution is to develop different types of email/sms campaigns depending on what threshold the end recipient is in.
A rating scale with a range, in increments of 20 points, has been adopted (the record is rated on a scale of 1-100). The higher the record is in our ranking, the “better” recipient it is.
It is worth noting that the analysis should take place over a longer period of time and other activities carried out in the account, so that the results are truthful. It is possible that the recipient a month ago showed a score of 80, a week ago 100, and today only 10. This does not mean that the record is bad or dormant, it may mean that he is not active in the email channel, but can make transactions.
The scoring is intended to help evaluate activity and select communications, but take into account more variables in the final evaluation of the record.
How to read the Channel Scoring report?
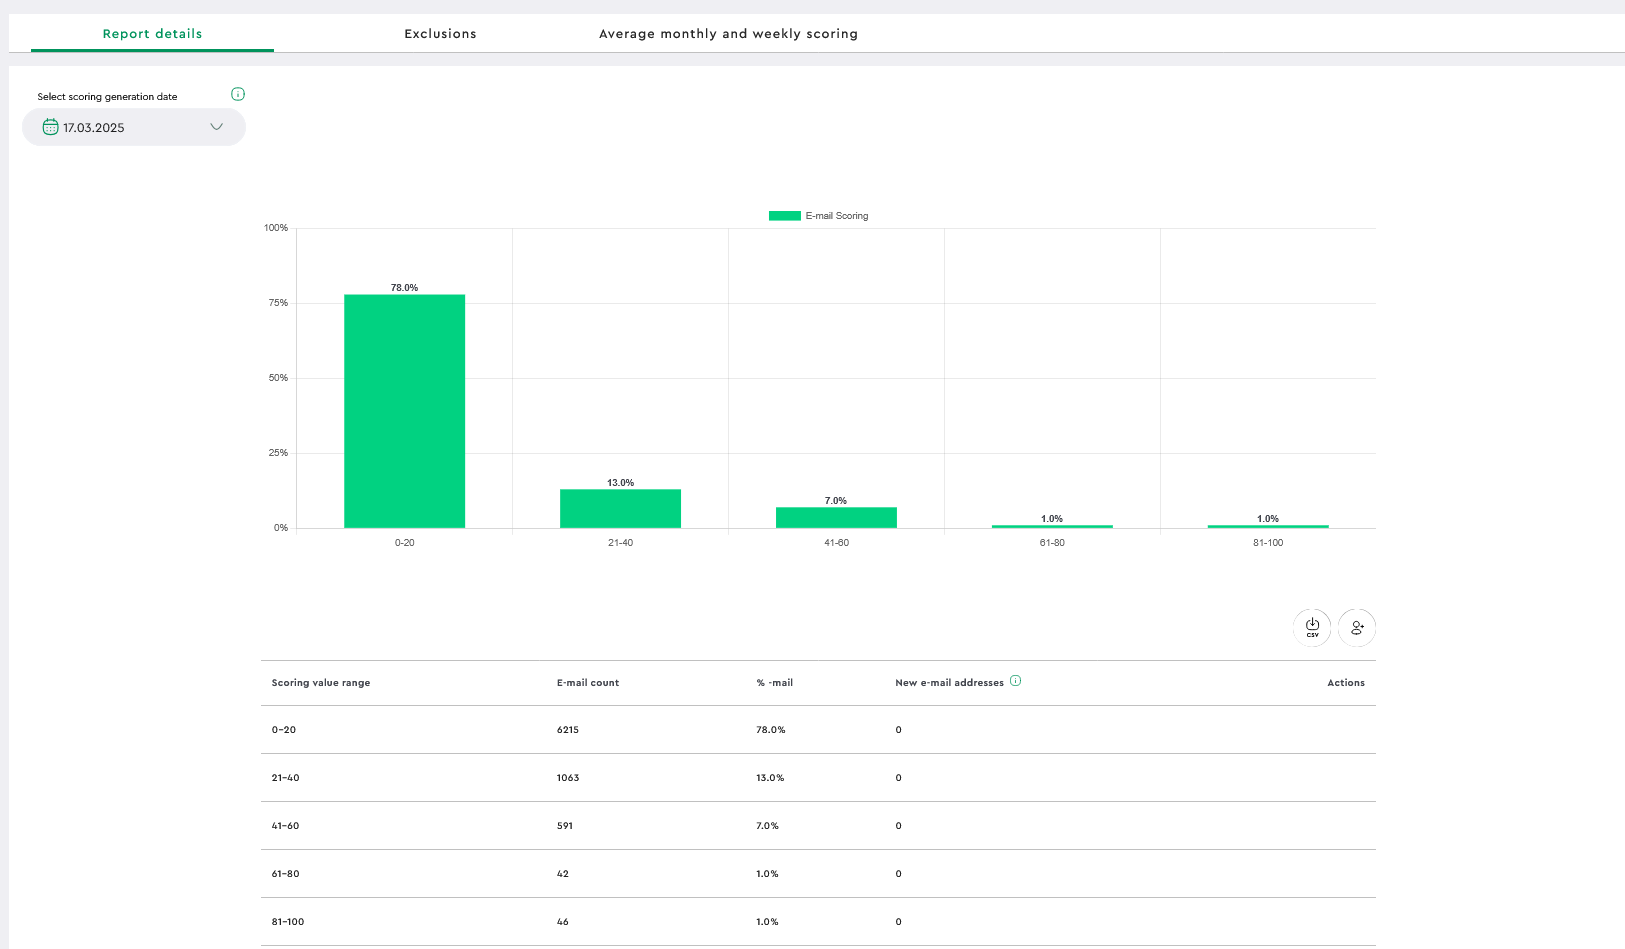
After entering the report (at the top of the window), a bar chart is visible, with the possibility of modifying the dates of the scoring range:
By going to the date range selection option, we can select the time period we are interested in.
Use the cursor to select the last day you want to analyze. The system will automatically set the first day of analysis based on the set time range.
NOTE: If you assume two weeks as the analysis period and select a range for the report, e.g. 1.01-14.01, a report for 15.01 will be generated.
- The vertical axis indicates the percentage of all users considered in the scoring.
- The horizontal axis is the ranges of users’ scores.
Below the bar report, the same data is presented in table form:
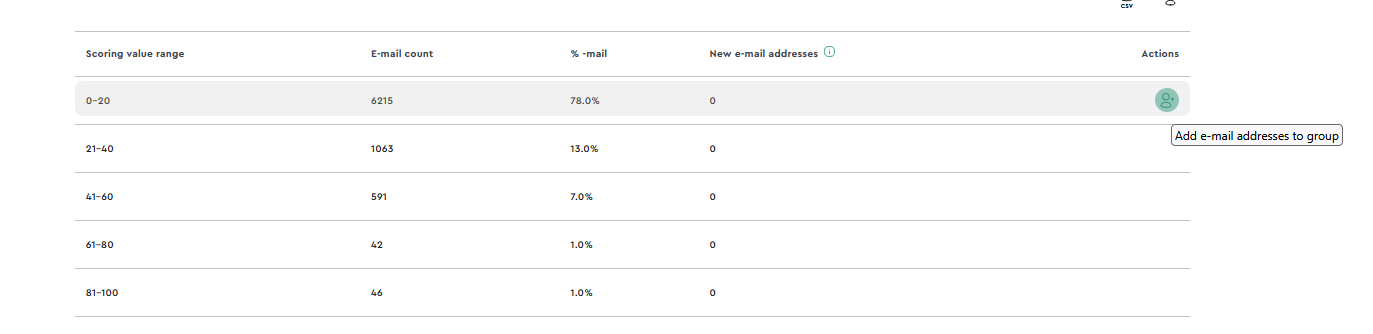
Here we have the ability to segment the base, based on the scoring results.
An action icon appears next to each of the point thresholds for email addresses:
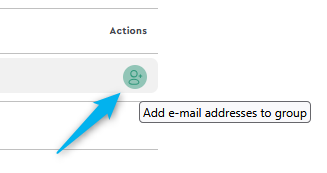
After clicking on the icon, a window will appear in which we can select a group from the database to which we want to assign all addresses from the selected scoring range:
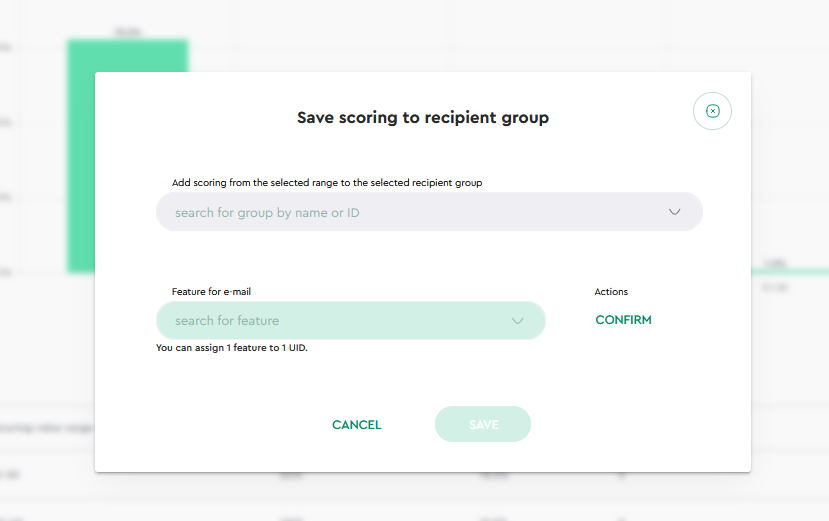
After selecting a group and clicking SAVE , the addresses will be added to it.
Time ranges for Channel Scoring reports
The range of time for which we will be able to generate a report depends on the option we have selected based on the price list. If we choose a scoring analysis for 3 months, then we will be able to analyze how the activity of our recipients changed over the 3-month stage in the selected date ranges. We will be able to analyze all addresses in any way we want, segment them into groups by date or score, combine or separate them into new mailing groups.
The maximum time period for which we will be able to generate scoring analysis calculations is a full year back from the date of purchase of the package.
If you have additional questions or would like to purchase a scoring module for your account, please contact your dedicated consultant or email [email protected]